Survey Sample Size: How to Calculate It (Bigger ≠ Better)
How to calculate survey sample size: Cochran's formula, confidence levels, finite population correction, and why a bigger sample doesn't fix bias.

There's a persistent belief in survey research that more responses always mean better data. It sounds intuitive: larger samples should be more accurate, more reliable, more trustworthy.
The reality is more nuanced. Sample size affects precision, not accuracy. A biased survey with 10,000 responses is just confidently wrong. And beyond a certain point, adding more responses yields diminishing returns while consuming resources that could be better spent elsewhere.
This guide explains how sample size actually works, when larger samples matter, when they don't, and how to calculate the right size for your research.
What Sample Size Actually Controls
Sample size primarily affects one thing: random sampling error, often expressed as the margin of error.
It does not fix:
- Sampling bias (who you're reaching)
- Response bias (how people answer)
- Construct validity (whether you're measuring the right thing)
- Question wording issues (ambiguity, leading questions)
According to Al-Subaihi (2003), sample size determination should account for population variability, desired confidence levels, and acceptable margins of error. But none of these calculations address whether your survey is actually measuring what you think it is.
We've seen teams collect 5,000 responses from a biased sample and make worse decisions than teams with 200 responses from a representative one.
The Diminishing Returns of Larger Samples
Here's the mathematical reality that surprises most people:
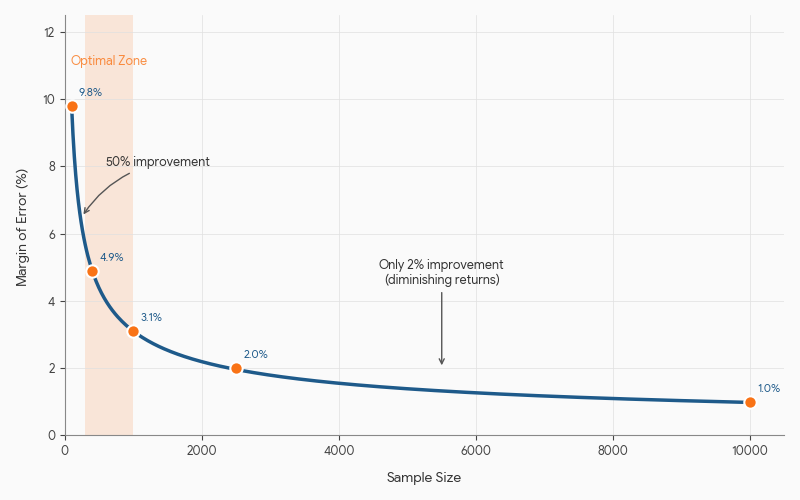
| Sample Size | Margin of Error (95% CI) | Improvement from Previous |
|---|---|---|
| 100 | ±9.8% | — |
| 400 | ±4.9% | 50% reduction |
| 1,000 | ±3.1% | 37% reduction |
| 2,500 | ±2.0% | 35% reduction |
| 10,000 | ±0.98% | 51% reduction |
Going from 100 to 400 responses cuts your margin of error in half. But going from 1,000 to 10,000 only improves precision by about 2 percentage points.
Eichenberger, Hulliger, and Potterat (2011) call this the "precision resolution" problem: at some point, you're measuring noise that doesn't affect your conclusions.
The practical implication: If you're deciding whether to invest in 1,000 more responses or better question design, better design almost always wins.
When Small Samples Are Actually Fine
Not every survey needs thousands of responses. Here's when smaller samples work:
Internal feedback surveys
If you're surveying 50 employees about office preferences, you don't need statistical significance. You need directional insight. A 60% response rate from 50 people (30 responses) tells you plenty.
Exploratory research
Early-stage research is about generating hypotheses, not confirming them. Adam (2021) notes that exploratory studies often require smaller samples because the goal is discovering patterns, not measuring their exact prevalence.
Homogeneous populations
If your population has low variability on the dimension you're measuring, you need fewer responses to detect patterns. A survey of licensed pilots about cockpit preferences has less variance than a general population survey about travel habits.
Qualitative-adjacent research
Open-ended questions with rich text responses often reach thematic saturation at 20-50 responses. More responses mean more coding work without necessarily revealing new themes.
When Large Samples Actually Matter
Sometimes you genuinely need more responses:
Subgroup analysis
If you need to analyze results by demographic segments, each segment needs sufficient responses. A 1,000-person survey with 10 demographic cuts means only 100 people per group on average, and some groups will have far fewer.
Rule of thumb: Plan for at least 100 responses per subgroup you intend to analyze separately.
Detecting small effects
If you're measuring a change you expect to be small (e.g., a 2% lift in satisfaction from a minor product change), you need larger samples to distinguish signal from noise.
The formula for detecting a specific effect size:
n = (Z²σ²) / E²
Where Z is the z-score for your confidence level, σ is population standard deviation, and E is the margin of error you'll accept.
High-stakes decisions
When decisions are irreversible or expensive, the cost of being wrong justifies larger samples. A survey informing a $10M product investment warrants more precision than a survey informing a blog post topic.
Regulatory or publication requirements
Academic journals and regulatory bodies often have minimum sample size requirements. These are constraints, not recommendations, and meeting them doesn't guarantee good data.
How to Calculate the Right Sample Size
The Yamane Formula
For most survey research, Yamane's (1967) simplified formula works well:
n = N / (1 + N × e²)
Where:
- n = required sample size
- N = population size
- e = margin of error (as decimal, e.g., 0.05 for ±5%)
Example: For a population of 10,000 with ±5% margin of error:
- n = 10,000 / (1 + 10,000 × 0.05²)
- n = 10,000 / 26
- n = 385 responses
Cochran's Formula (More Precise)
For populations over 50,000 or when you need more precision:
n₀ = (Z² × p × q) / e²
Where:
- Z = z-score for confidence level (1.96 for 95%)
- p = estimated proportion (use 0.5 if unknown)
- q = 1 - p
- e = margin of error
Then apply finite population correction if your population is known:
n = n₀ / (1 + ((n₀ - 1) / N))
Online Calculators
For quick calculations:
The Real Question: Representative of What?
Sample size calculations assume random sampling from a defined population. But most surveys don't have random samples. They have:
- Convenience samples (whoever responds)
- Self-selected samples (people who choose to participate)
- Panel samples (pre-recruited respondents)
For these samples, the standard margin of error formulas don't apply the way textbooks suggest. A large non-random sample isn't necessarily better than a smaller one.
The better question isn't "how many responses do I need?" but "who are these responses representing?"
This connects directly to survey bias. Non-response bias doesn't shrink with larger samples. It compounds.
Sample Size for Different Survey Types
| Survey Type | Typical Range | Key Consideration |
|---|---|---|
| Customer satisfaction (B2C) | 300-1,000 | Subgroup analysis needs |
| Customer satisfaction (B2B) | 100-300 | Smaller populations |
| Employee engagement | All employees | Response rate matters more than size |
| Market research | 500-2,000 | Depends on segmentation needs |
| Academic research | Per power analysis | Effect size detection |
| UX research | 20-50 | Qualitative depth |
| Product feedback | 100-500 | Directional insight |
What to Do Instead of Chasing More Responses
If you have budget or time to invest in your survey, consider these alternatives to simply collecting more responses:
Improve response rate
A 30% response rate from 1,000 invites is often better than a 5% response rate from 6,000 invites, because higher response rates typically mean less non-response bias.
Invest in question design
One hour spent improving question wording yields better data than one hour spent collecting more responses from a flawed instrument.
Pilot test properly
Pilot testing catches issues that no amount of additional responses will fix. Presser et al. (2004) found that 30% of survey questions are revised after cognitive testing.
Validate your sampling frame
Make sure your sample actually represents your target population before worrying about size.
Consider mixed methods
Sometimes 50 survey responses plus 10 interviews provide better insight than 500 survey responses alone.
Pre-Launch Sample Size Checklist
Before finalizing your sample size target:
- What's the smallest subgroup you need to analyze?
- What's the smallest effect size you need to detect?
- What's your expected response rate?
- Is your sampling method actually random?
- Have you accounted for incomplete responses?
- What's the cost of being wrong vs. the cost of more responses?
- Would better questions help more than more responses?
The Bottom Line
Sample size is a tool, not a goal. It controls random error, not systematic error. And its benefits diminish rapidly after a few hundred responses.
The surveys that produce actionable insights aren't necessarily the ones with the most responses. They're the ones that ask the right questions to the right people and interpret the results honestly.
More data from a flawed instrument just means more confidence in the wrong answer.
Frequently Asked Questions
What's the minimum sample size for statistical significance?
There's no universal minimum. It depends on your confidence level, margin of error, population variability, and effect size you're trying to detect. For general surveys, 100-400 responses often provide sufficient precision for directional decisions. For academic research requiring statistical hypothesis testing, conduct a proper power analysis.
Does sample size affect reliability or validity?
Sample size primarily affects the reliability of your estimates (consistency). It doesn't affect validity (whether you're measuring the right thing). A valid instrument with 100 responses beats an invalid instrument with 10,000. See our guide on survey validity vs reliability.
Should I oversample to account for non-responses?
Yes, but calculate it explicitly. If you need 400 complete responses and expect a 25% response rate, you need to invite 1,600 people. But don't confuse "sent invites" with "sample size" in your analysis.
About the Author
The Lensym Team builds survey research tools for teams that value both data quality and usability. We've seen too many surveys collect thousands of responses from flawed instruments, and we're working to change that.
On this page
Continue Reading
More articles you might find interesting

Acquiescence Bias: What It Is, Examples & How to Reduce
Acquiescence bias is the tendency to agree regardless of content. Real survey examples, why it happens, and the methods that reliably reduce it.

Anonymous Surveys and GDPR: What Researchers Must Document
GDPR's definition of anonymity is strict. Requirements for true anonymization, when pseudonymization suffices, and documentation obligations for each.

Central Tendency Bias: What It Is, Examples & How to Prevent
Central tendency bias is when respondents cluster on middle scale options. Examples, why it happens on Likert scales, and how to prevent it.