
Analyse your survey
Read the results with the response context intact.
Lensym separates collection progress, question summaries and individual submissions. Move between those views to understand what respondents answered, which group a result describes and where you need to inspect the underlying data.
Survey analytics is available on every plan. Export format availability varies by plan. Compare plans
Collection in context
See starts, completions, status and timing together. Distinguish a finished response from one still in progress before interpreting collection totals.
Summaries suited to the question
Choice counts, numeric distributions and item-level summaries reflect different answer structures. The form of the question shapes how its results are presented.
Access to the underlying answers
Move from a question summary to individual submissions when a result needs explanation. Read the recorded answers alongside their status and timing.
Interactive example
Explore two kinds of workshop results
Switch between a question about the most useful workshop session and one about time spent on a practical task. Both summaries use 96 invented responses, not results from a real study.
An overview of how collection is progressing
Collection produces several related questions: how many sessions began, how many reached the end and how long completed attempts took. Lensym’s Overview brings these measures together with a response-status breakdown, giving you a picture of progress before you examine individual questions.
These measures describe different aspects of participation. A completed respondent may have bypassed a branch or left an optional answer blank. A short time can reflect a short route. Seeing status and timing together provides a basis for investigation without turning either measure into an automatic judgement about response quality.
Question analysis that follows the structure of the data
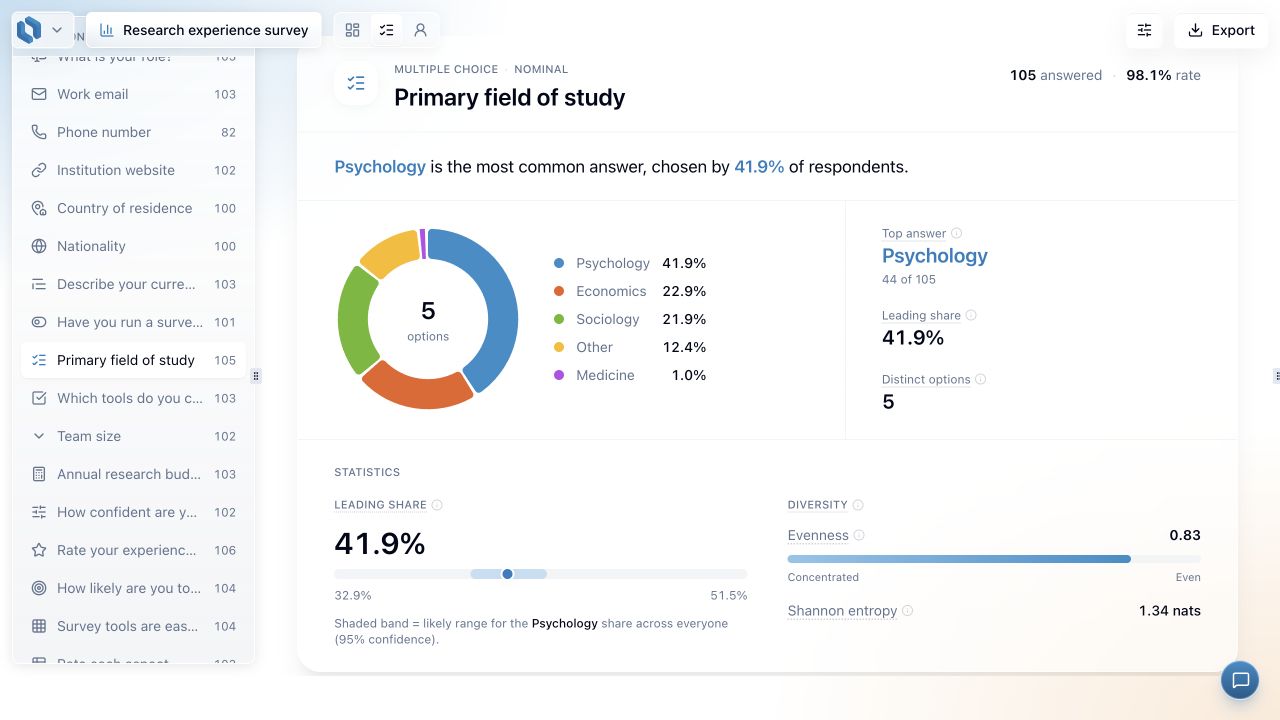
A choice, a ranking and a numeric answer carry different information. Lensym presents option counts and proportions for choices, distributions and summary values for numbers and scales, and results by item, statement or row for Ranking, Likert and Matrix questions. Text summaries provide another starting point for reading qualitative material.
That structure matters to interpretation. A checkbox respondent can select several options; a Matrix contains several rows; a follow-up may only apply to one route. Keeping the answer count and question structure close to the summary helps you identify the population and measure a result actually describes.
Illustrative evaluation workflow
Understand a course evaluation with a placement-specific follow-up
A course evaluation receives 100 completed responses. Sixty students took a work placement, so only that group reaches the placement questions. The course team wants to understand both the overall experience and the placement feedback without presenting the smaller group as everyone.
Overview describes collection, Questions shows the relevant answers and Responses provides the detail behind individual submissions. Moving between those views keeps the interpretation connected to the questionnaire’s design. The counts are illustrative; they show why a completed survey and an answered follow-up are different units of observation.
Establish the collection picture
The team reviews starts, completions and unfinished statuses. It identifies the collection period before comparing results, rather than assuming every person who started supplied a complete response.
Read the placement results as a subgroup
The placement rating is examined with its answer count and distribution. An optional question can have fewer than 60 answers even though all 100 respondents completed the questionnaire.
Investigate the questions behind a result
When a rating or comment needs context, the team reads the relevant submission. Completed data can then be exported for further analysis with the group definitions kept explicit.
A route from the pattern back to the response
Summaries make patterns visible, but interpretation often needs the original answers. Responses presents individual submissions with their status, timestamps, available completion time and answers in question order. That gives you a place to examine an unusual value or read a full explanation.
The connection is useful for both numeric and written feedback. The same average can arise from different distributions, and a frequent word can appear in very different contexts. Lensym supports moving between the overall pattern and the specific record while leaving the substantive interpretation with the researcher.
Comparisons with an explicit population and period
Status and date filters let you define the responses under examination. Questions and Responses default to completions and can include saved unfinished responses when those statuses are selected. Displayed timezones make the calendar boundaries explicit, including whole selected days.
Overview describes starts; completed-answer views use completion dates for finished responses and start dates for unfinished ones. Someone who begins on Monday and finishes on Tuesday can therefore contribute to different daily totals. Knowing that distinction makes comparisons between collection activity, question results and exported data more interpretable.
Common questions
- Why are there fewer answers than completed responses?
- The question may have been optional or bypassed by a branch. Check its answer count, the relevant route and your filters before interpreting the difference as missing data.
- Can I inspect unfinished responses?
- Yes. Select the relevant statuses in Questions or Responses to inspect saved incomplete answers. Downloads currently include completed responses only.
Ready to set it up?
The documentation covers the controls, settings and worked examples.
Look beyond a total to the answers it represents.
Explore collection progress, question summaries and individual submissions in one survey. Analytics is included on every plan, with exports available for further analysis.
Related features
Survey data export
Download responses and reports in CSV, Excel, PDF or Word, with controls for the data you include.
Conditional survey logic
Give respondents a relevant path through your survey, using conditions based on their answers.
Survey randomization
Assign respondents to experimental conditions with weighted Split paths and random or balanced allocation.